Sales Analytics


Report Details:
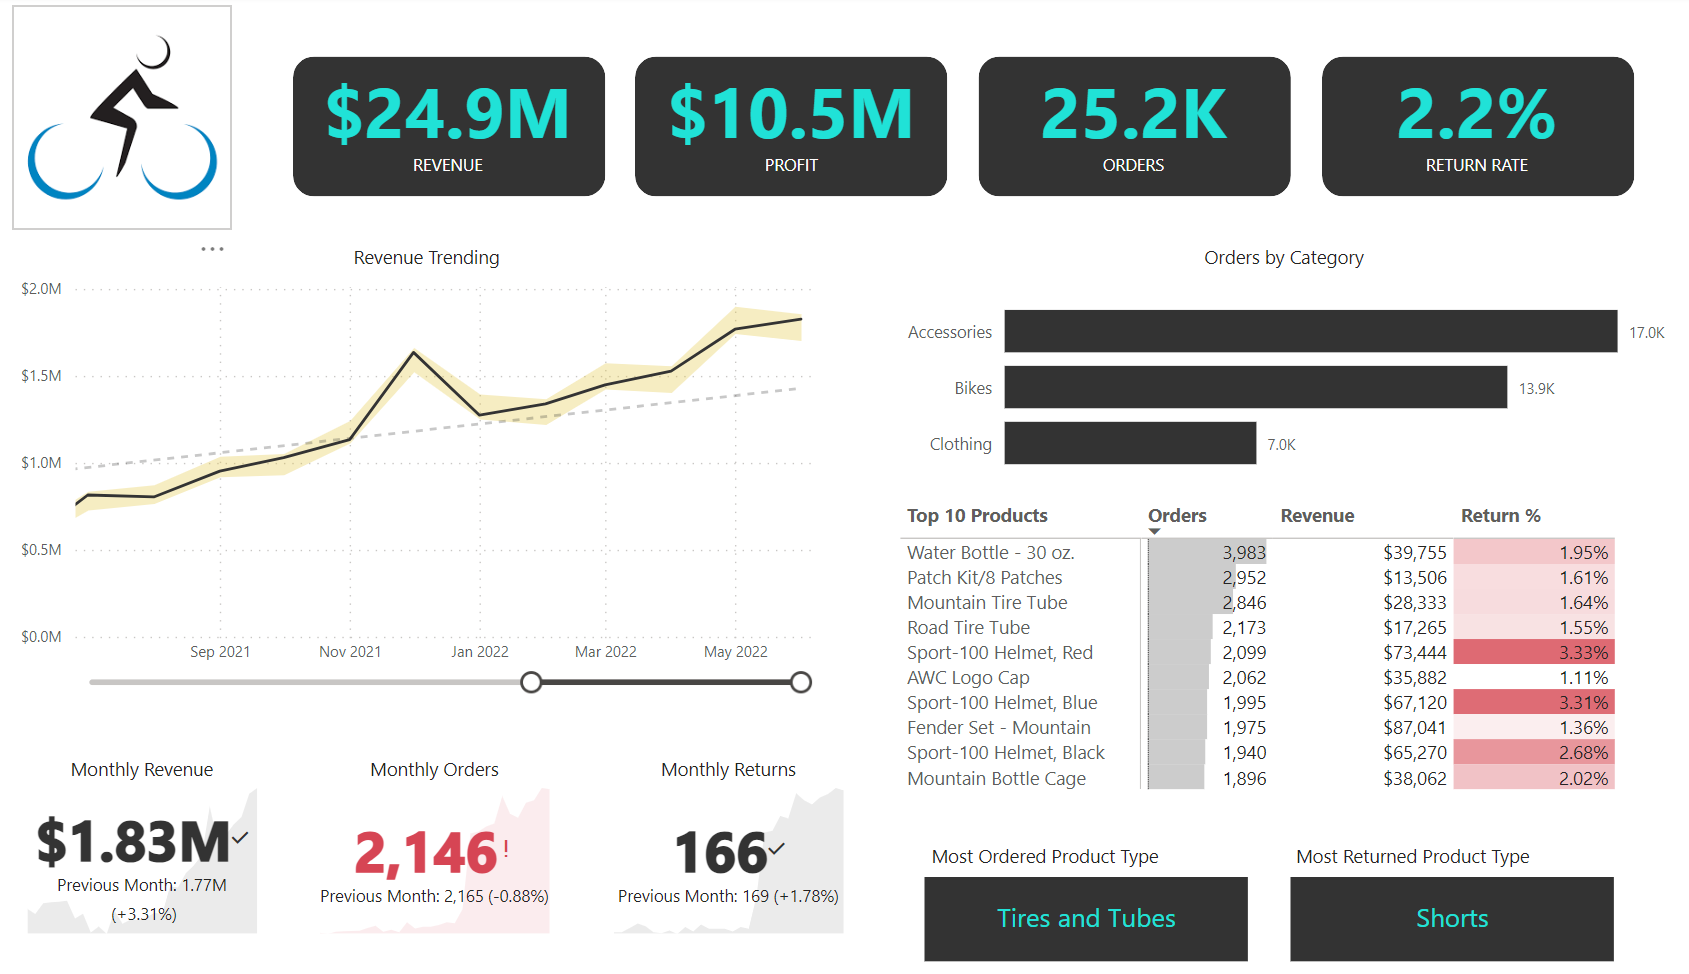
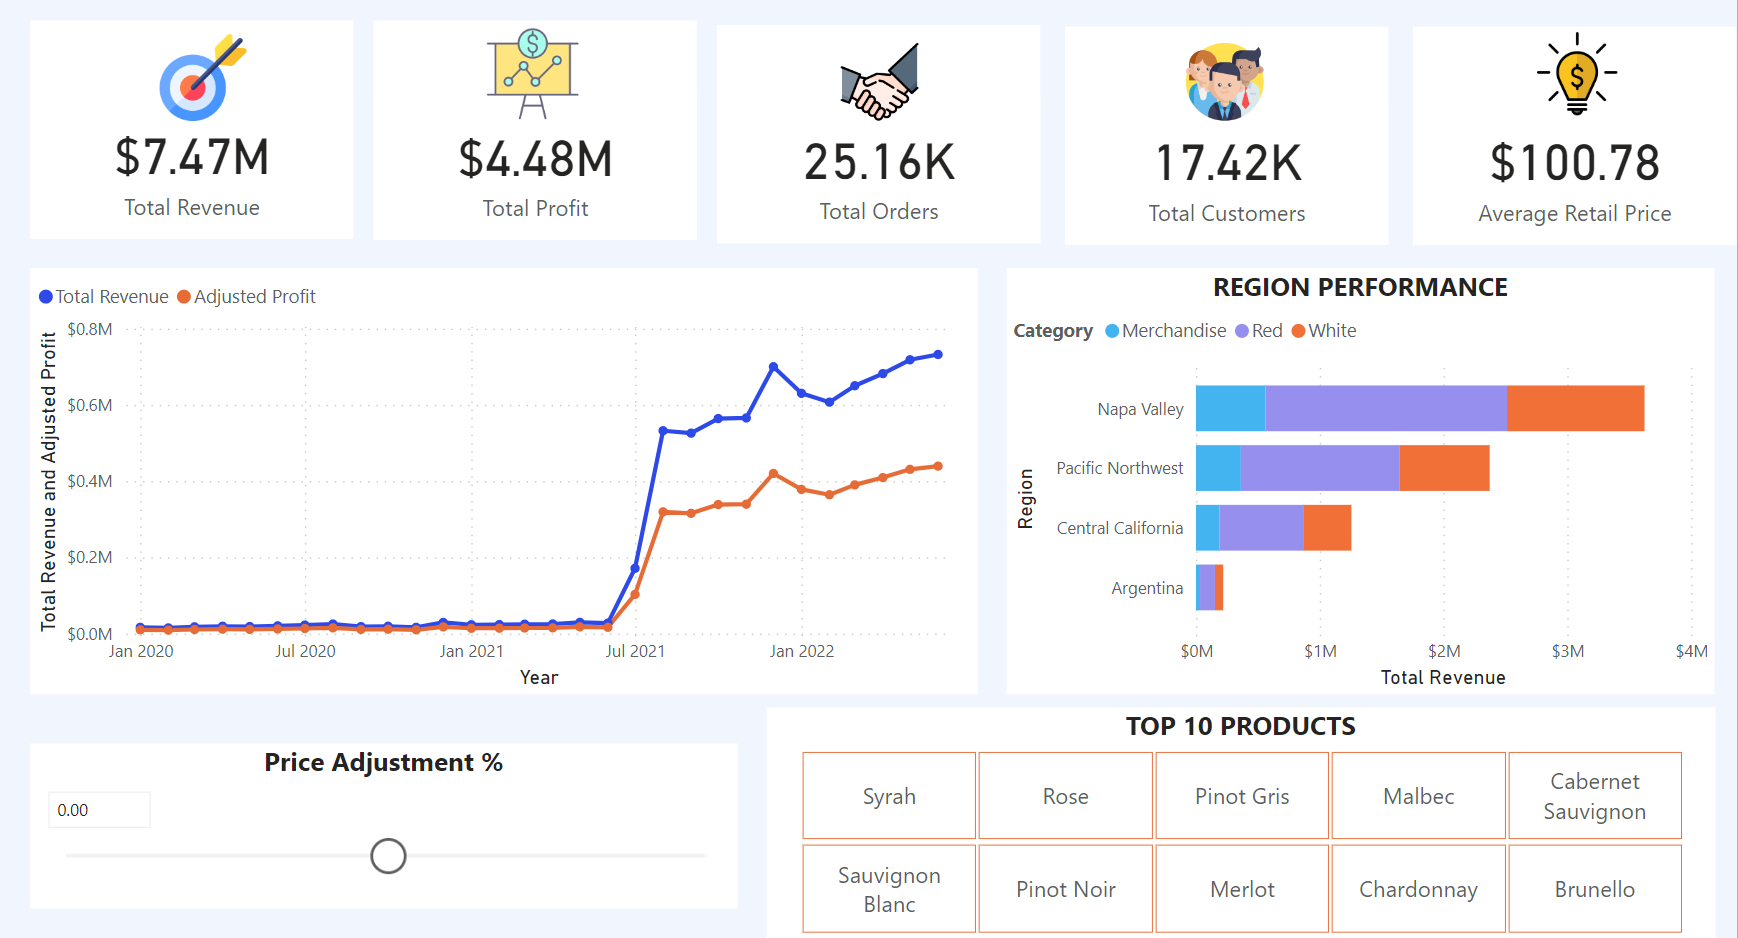
- Executive Dashboard features top four organizational KPIs.
- Line charts display an active trend line and offer an interactive slider to dynamically adjust the trending date range.
- KPI cards on the bottom row are conditionally formatted to display red text when KPI targets are not met and black text when targets are met.
- Report summary leverages Artificial Intelligence to callout potential data anomalies and highlight areas of strength and opportunity.
- Map view provides visual insight into the volume of sales, according to geography.
- The top slider offers consumers drill-in functionality, dynamically engaging with sales data, broken down by country, state, and city.
- Drill in capability is fully functional on all product categories and data tables.
Description
Treebottom
3.12.2023
Analyzing Key KPIs around Sales, Returns, and Profitability


