Product Analytics
Project Overview
Brief Description
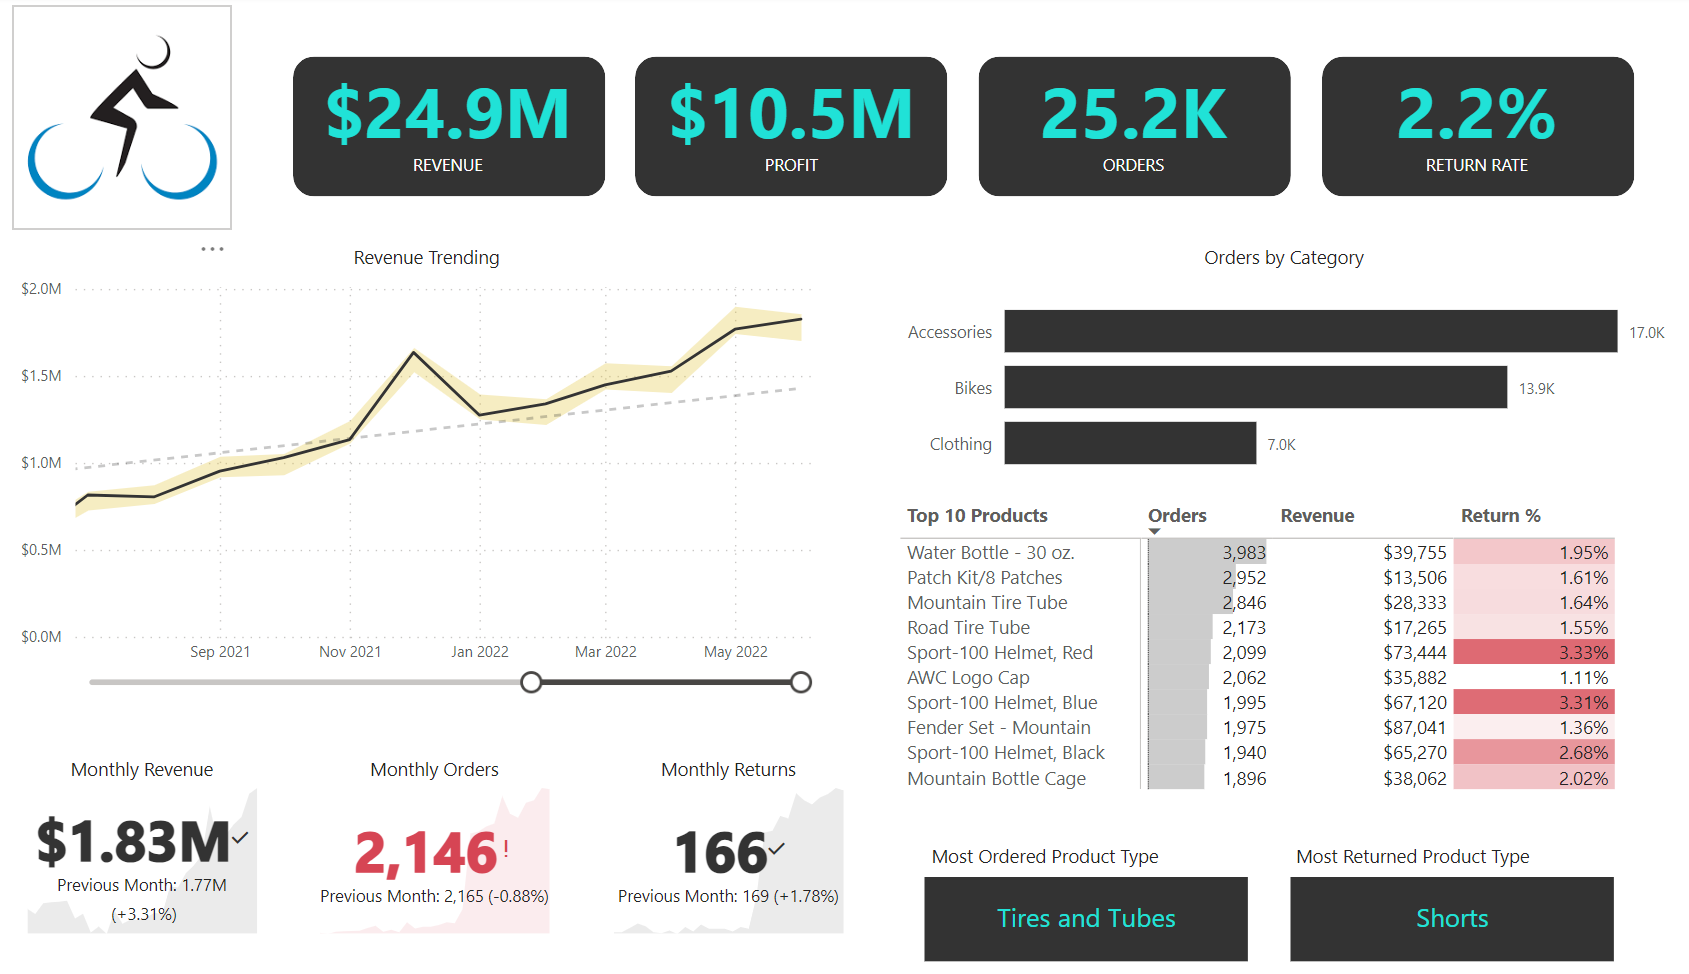
This project involved developing a comprehensive product analytics dashboard to dissect product sales, customer engagement, and operational efficiency. A goal I'd have for this report is to discover strategic insights that drive the rapid development of scalability.
Goals and Objectives
The main objectives were to:
- Enhance data-driven decision-making for product strategies.
- Identify key performance indicators that align with business growth opportunities.
- Create a user-friendly dashboard to visualize complex datasets.
Dashboard Features and Functionality
- Sales tracking
- Customer segmentation analysis
- Inventory and supply chain optimization metrics
Level 1 Analysis: Top-level KPIs:
- Total sales revenue
- Total profit
- Total orders
- Return rate
Level 2 Analysis: A deeper dive into:
- Revenue trends
- Order breakout by category
- Top 10 product analysis featuring orders, revenue, and return %
Level 3 Analysis: Month-to-Month Revenue Analysis
- Detailed tracking of revenue, orders, and returns, incorporating conditional logic for comparative insights against the previous month.
- Product scorecard
Design and Development Process
The design process started with wireframing to ensure the dashboard's layout presented information coherently. Utilizing ChatGPT Pro, I conducted a thorough data pre-processing to cleanse the data, handle null values, normalize data ranges, and detect any anomalies. The dataset acquired from Maven Analytics was well-structured and didn't require major transformations or integration with multiple data sources. The development phase focused on transforming this curated dataset into an engaging and intuitive dashboard.
Conclusion and Reflections
Transforming raw data into a strategic asset was a key achievement in this project. I also enjoyed testing the Power BI Artificial Intelligence functionality and found it to be intuitive. But better than that, I found the summaries to be surprisingly insightful. Reflection on the process underscores the importance of a clear understanding of an end-user's needs. In this case, I wanted to deep-dive into product analytics.
Description
Product Analytics Dashboard for Cycling Company


